Avoid pseudo-three-dimensional plots

Rafael Irizarry

The figure below, taken from the scientific literature[1], shows three variables: dose, drug type and survival. Although your screen/book page is flat and two-dimensional, the plot tries to imitate three dimensions and assigned a dimension to each variable.

A three dimensional line graph titled "Proportion Survived" shows survival rates for different drug types.
Avoid three dimensional graphs when they are not needed. Image courtesy of Karl Broman.

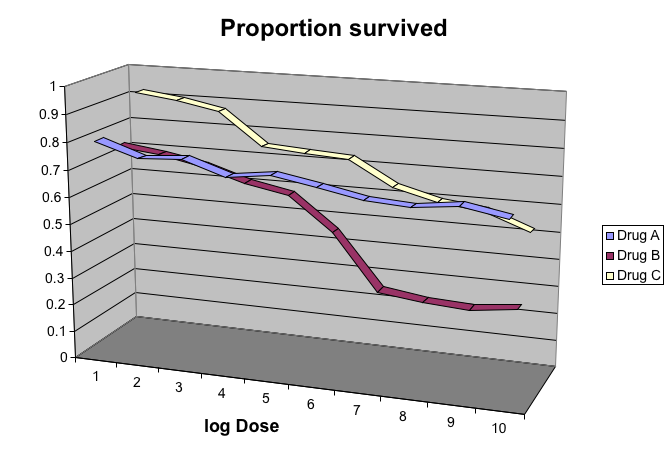
Humans are not good at seeing in three dimensions (which explains why it is hard to parallel park) and our limitation is even worse with regard to pseudo-three-dimensions. To see this, try to determine the values of the survival variable in the plot above. Can you tell when the purple ribbon intersects the red one? This is an example in which we can easily use color to represent the categorical variable instead of using a pseudo-3D:

Line graph titled "Proportion Survived" shows survival rates for different drug types.
Survival data represented in a two-dimensional format.

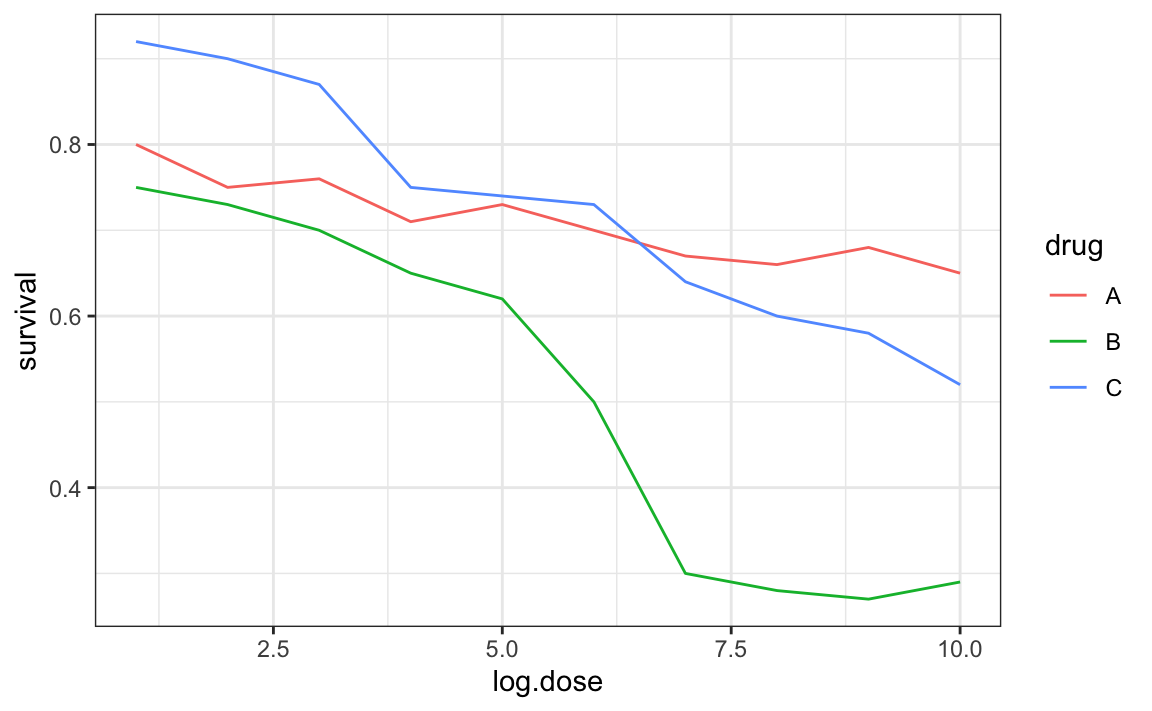
Notice how much easier it is to determine the survival values.

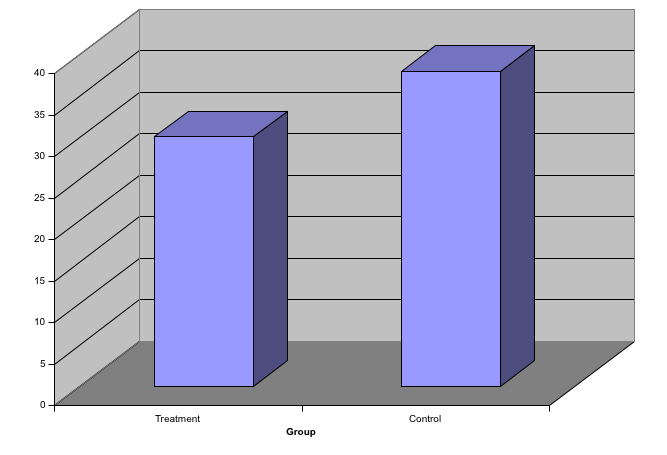
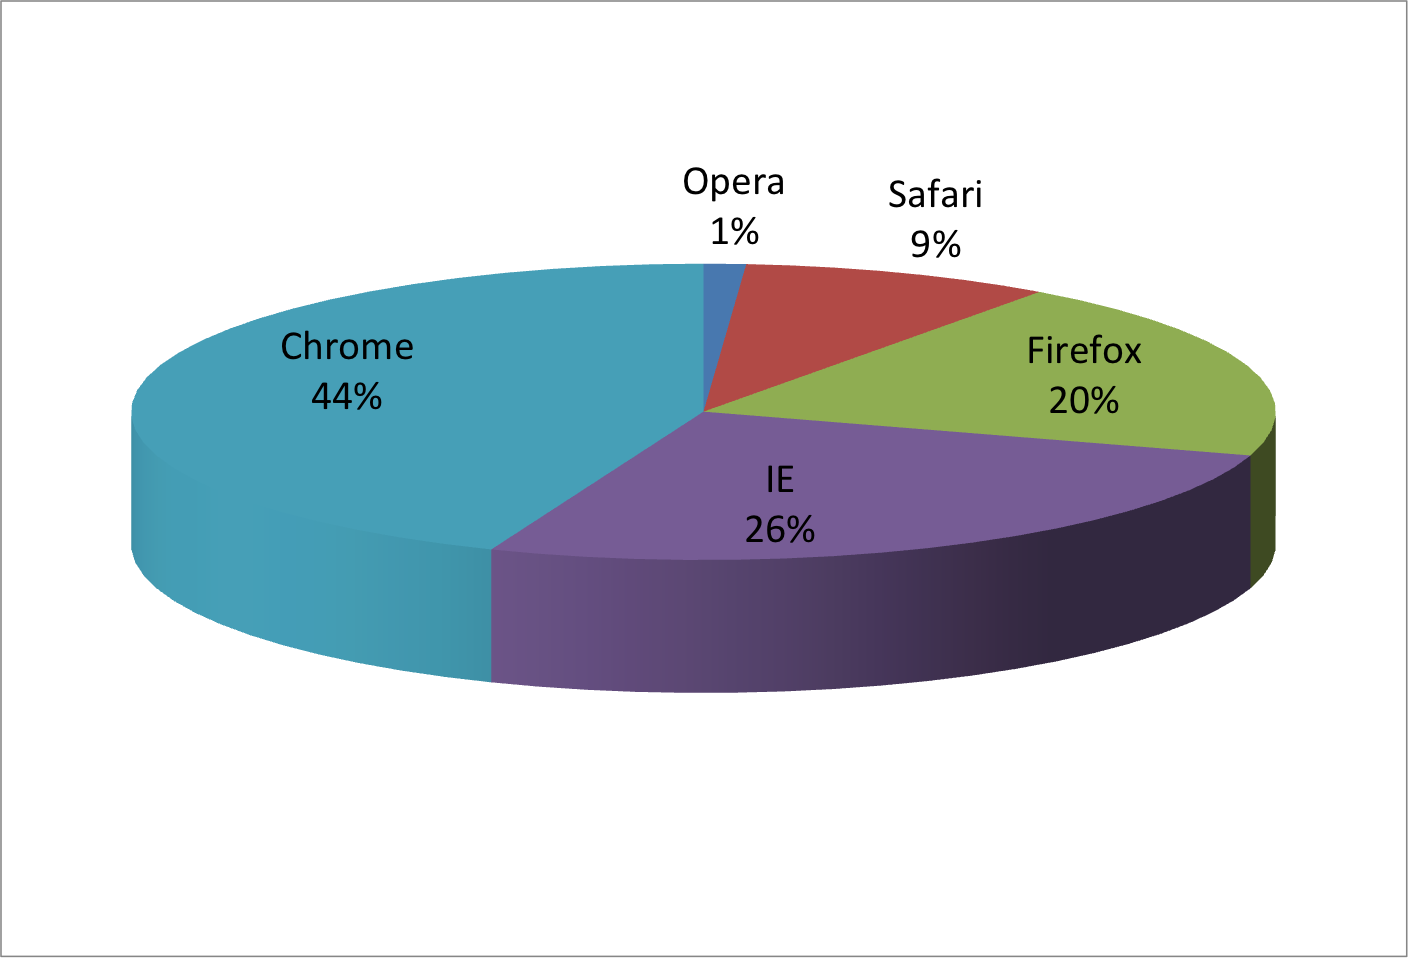
Pseudo-3D is sometimes used completely gratuitously: plots are made to look 3D even when the 3rd dimension does not represent a quantity. This only adds confusion and makes it harder to relay your message. Here are two examples:

A three dimensional bar chart titled "Number of People in Treatment and Control Groups" shows the number of people in a study by treatment group.
A third dimension to this graph does not add any useful information.
A three dimensional pie chart titled "Browser usage share" shows the distribution of web browser usage among desktop users. Chrome has the largest share at 44%, followed by Internet Explorer (IE) at 26%, Firefox at 20%, Safari at 9%, and Opera at 1%.
In some cases, adding a third dimension to graphs can make them uninterpretable. Images courtesy of Karl Broman.

License

Icon for the Creative Commons Attribution-NonCommercial-ShareAlike 4.0 International License

Business Analytics Copyright © by Rafael Irizarry is licensed under a Creative Commons Attribution-NonCommercial-ShareAlike 4.0 International License, except where otherwise noted.

Share This Book