
Explain Individual Predictions
Christoph Molnar
How much has each feature of an instance contributed to the prediction? This can be answered by computing the effects for this instance. An interpretation of instance-specific effects only makes sense in comparison to the distribution of the effect for each feature. We want to explain the prediction of the linear model for the 6-th instance from the bicycle dataset. The instance has the following feature values.
| Feature | Value |
|---|---|
| season | WINTER |
| yr | 2011 |
| mnth | JAN |
| holiday | NO HOLIDAY |
| weekday | THU |
| workingday | WORKING DAY |
| weathersit | GOOD |
| temp | 1.604356 |
| hum | 51.8261 |
| windspeed | 6.000868 |
| cnt | 1606 |
| days_since_2011 | 5 |
To obtain the feature effects of this instance, we have to multiply its feature values by the corresponding weights from the linear regression model. For the value “WORKING DAY” of feature “workingday”, the effect is, 124.9. For a temperature of 1.6 degrees Celsius, the effect is 177.6. We add these individual effects as crosses to the effect plot, which shows us the distribution of the effects in the data. This allows us to compare the individual effects with the distribution of effects in the data.
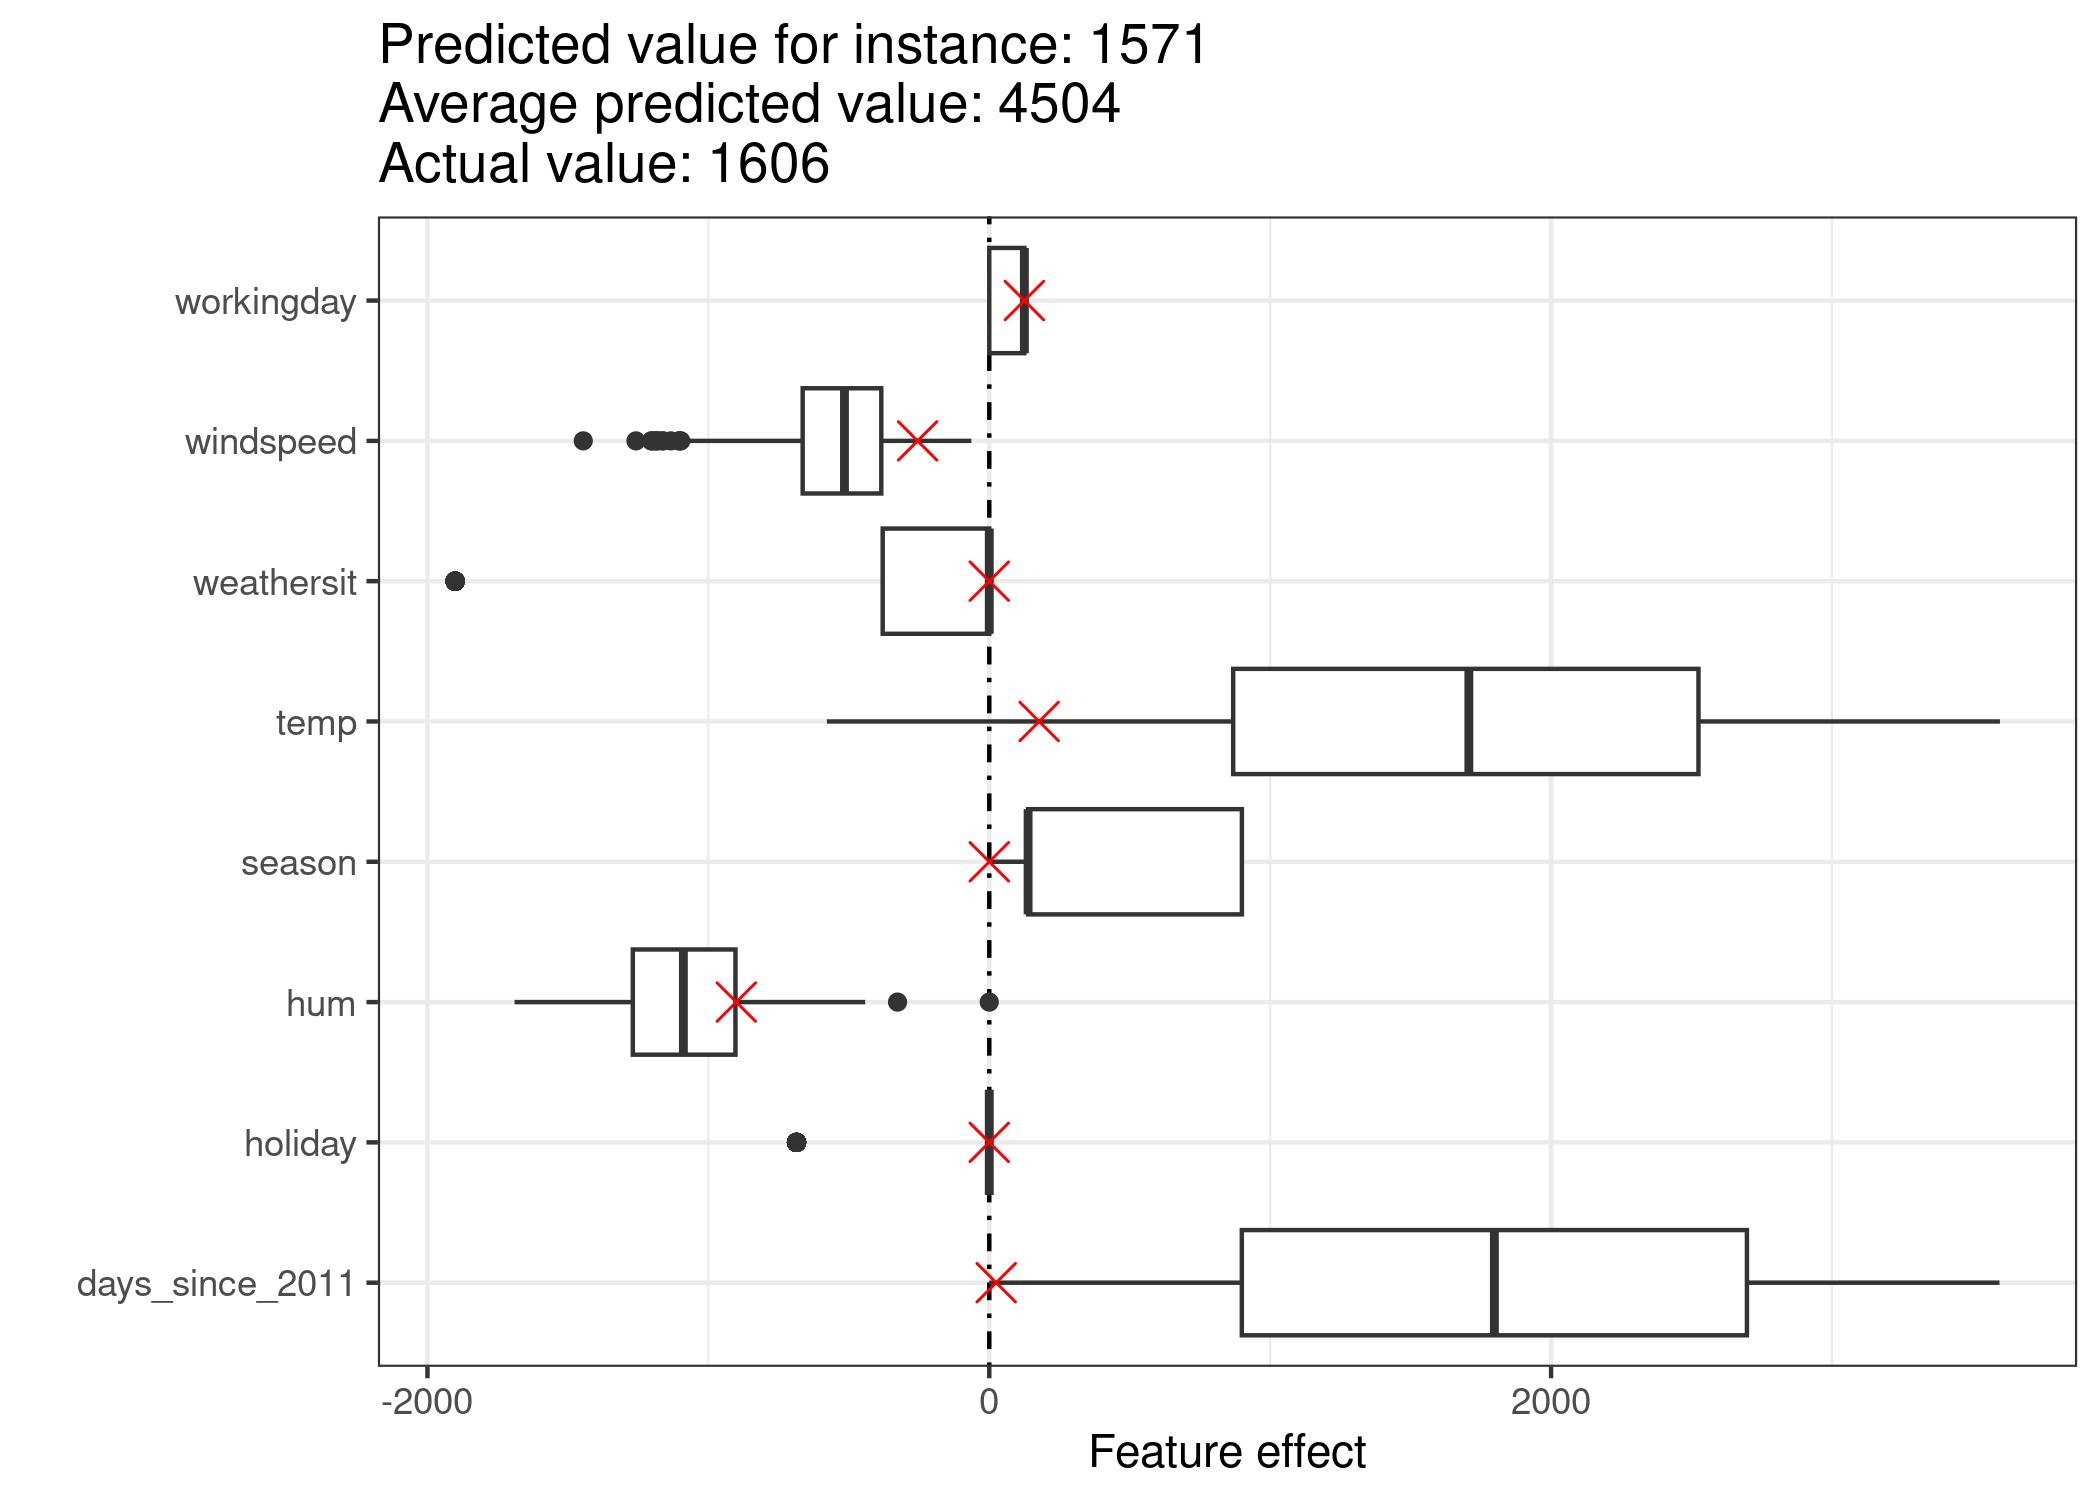
If we average the predictions for the training data instances, we get an average of 4504. In comparison, the prediction of the 6-th instance is small, since only 1571 bicycle rents are predicted. The effect plot reveals the reason why. The boxplots show the distributions of the effects for all instances of the dataset, the crosses show the effects for the 6-th instance. The 6-th instance has a low temperature effect because on this day the temperature was 2 degrees, which is low compared to most other days (and remember that the weight of the temperature feature is positive). Also, the effect of the trend feature “days_since_2011” is small compared to the other data instances because this instance is from early 2011 (5 days) and the trend feature also has a positive weight.
