
3 Logistic Regression
Christoph Molnar
Logistic regression models the probabilities for classification problems with two possible outcomes. It’s an extension of the linear regression model for classification problems.
What is Wrong with Linear Regression for Classification?
The linear regression model can work well for regression, but fails for classification. Why is that? In case of two classes, you could label one of the classes with 0 and the other with 1 and use linear regression. Technically it works and most linear model programs will spit out weights for you. But there are a few problems with this approach:
A linear model does not output probabilities, but it treats the classes as numbers (0 and 1) and fits the best hyperplane (for a single feature, it is a line) that minimizes the distances between the points and the hyperplane. So it simply interpolates between the points, and you cannot interpret it as probabilities.
A linear model also extrapolates and gives you values below zero and above one. This is a good sign that there might be a smarter approach to classification.
Since the predicted outcome is not a probability, but a linear interpolation between points, there is no meaningful threshold at which you can distinguish one class from the other. A good illustration of this issue has been given on Stackoverflow.
Linear models do not extend to classification problems with multiple classes. You would have to start labeling the next class with 2, then 3, and so on. The classes might not have any meaningful order, but the linear model would force a weird structure on the relationship between the features and your class predictions. The higher the value of a feature with a positive weight, the more it contributes to the prediction of a class with a higher number, even if classes that happen to get a similar number are not closer than other classes.
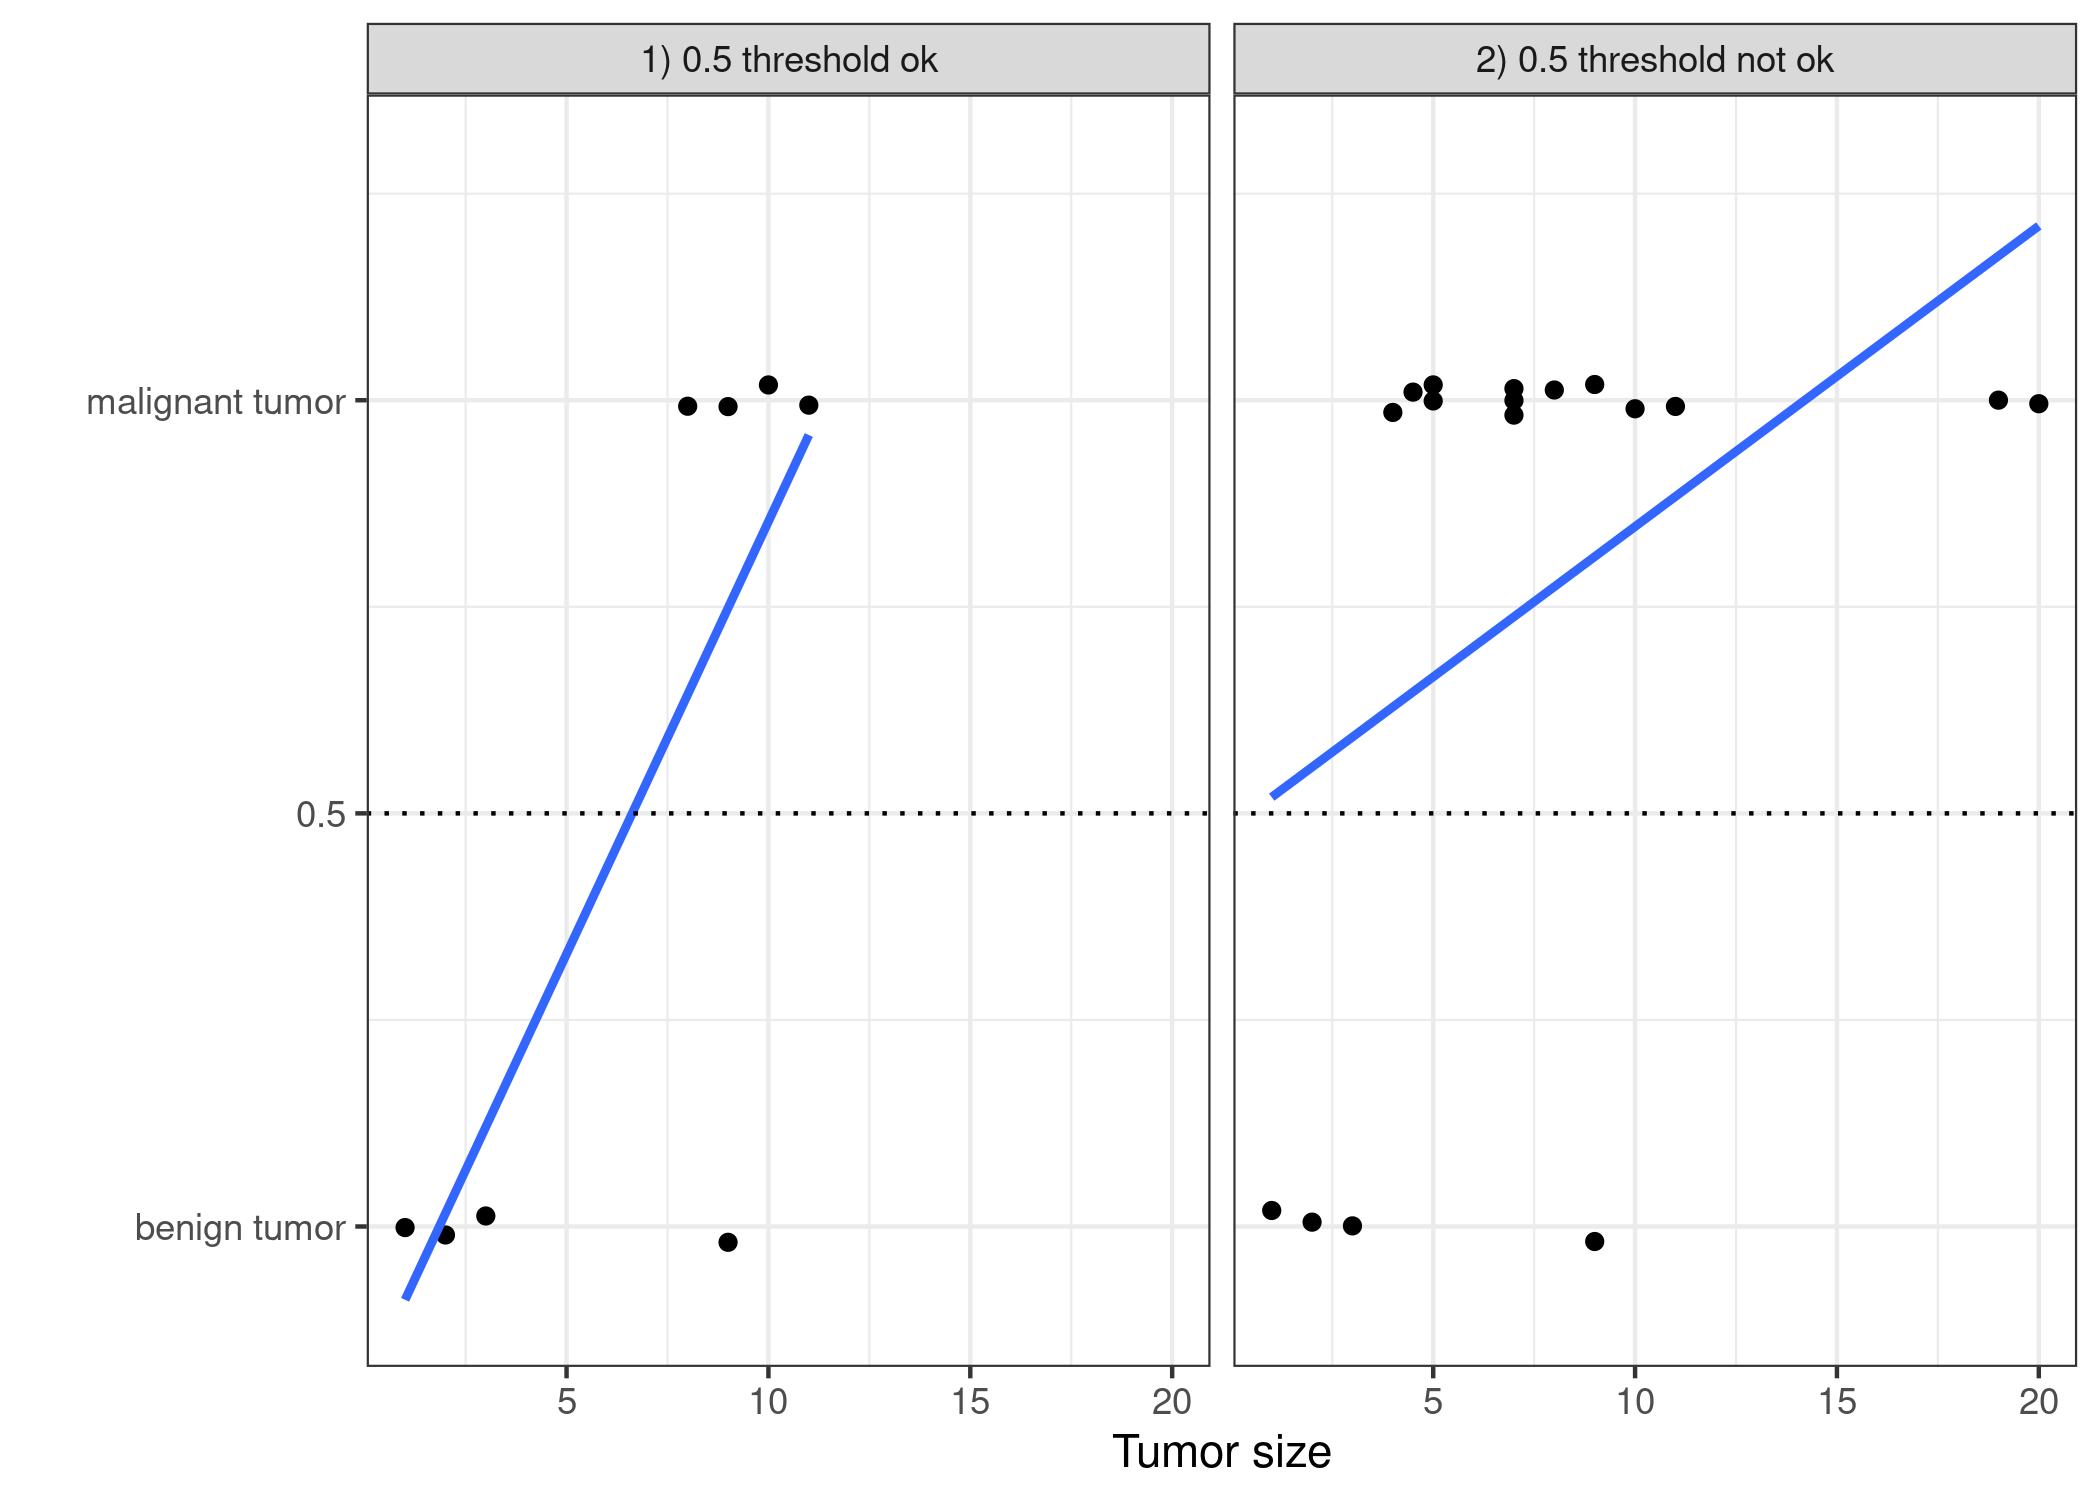
The lines show the prediction of the linear model. For the data on the left, we can use 0.5 as classification threshold. After introducing a few more malignant tumor cases, the regression line shifts and a threshold of 0.5 no longer separates the classes. Points are slightly jittered to reduce over-plotting.
