
Order categories by a meaningful value
Rafael Irizarry
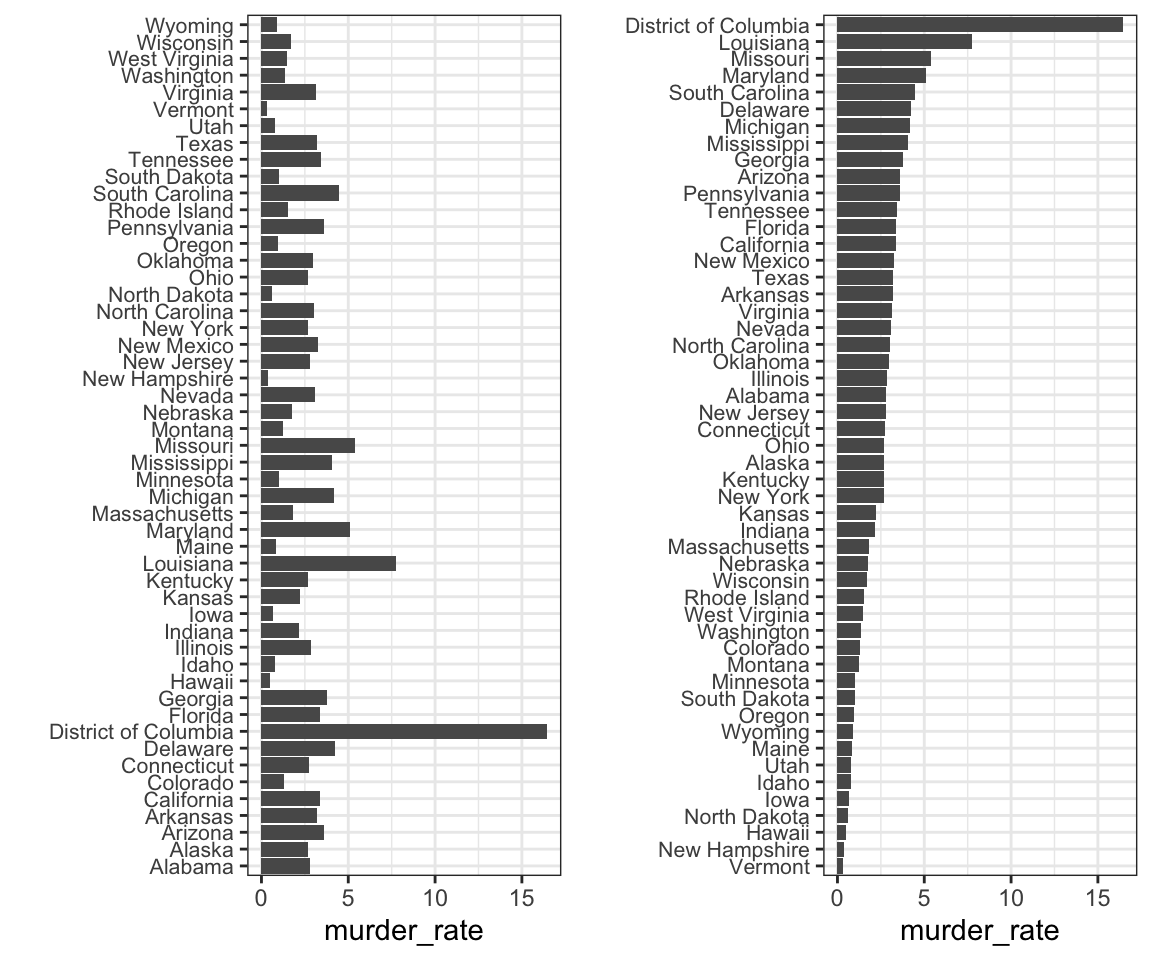
When one of the axes is used to show categories, as is done in barplots, the default is to order the categories alphabetically when they are defined by character strings. If they are defined by factors, they are ordered by the factor levels. We rarely want to use alphabetical order. Instead, we should order by a meaningful quantity. In all the cases above, the barplots were ordered by the values being displayed. The exception was the graph showing barplots comparing browsers. In this case, we kept the order the same across the barplots to ease the comparison. Specifically, instead of ordering the browsers separately in the two years, we ordered both years by the average value of 2000 and 2015.
We previously learned how to use the reorder function, which helps us achieve this goal. To appreciate how the right order can help convey a message, suppose we want to create a plot to compare the murder rate across states. We are particularly interested in the most dangerous and safest states. Note the difference when we order alphabetically (the default) versus when we order by the actual rate:
Earlier we saw an example related to income distributions across regions. Here are the two versions plotted against each other:
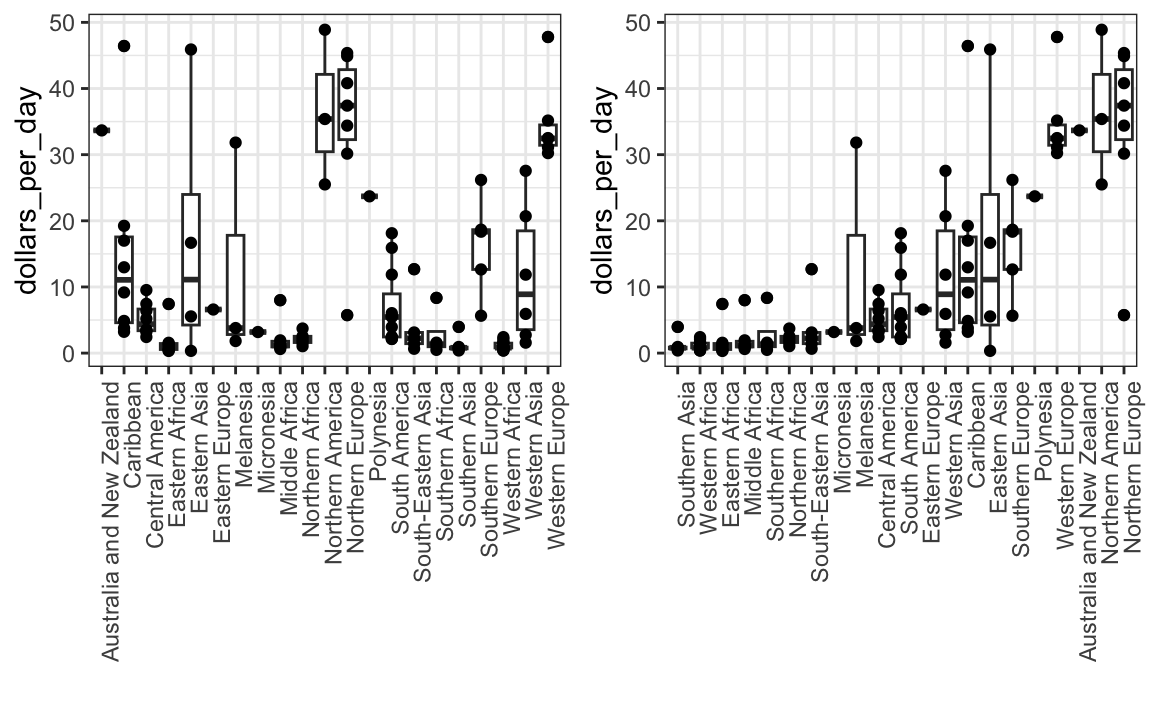
The first orders the regions alphabetically, while the second orders them by the group’s median.
