
Theory
Christoph Molnar
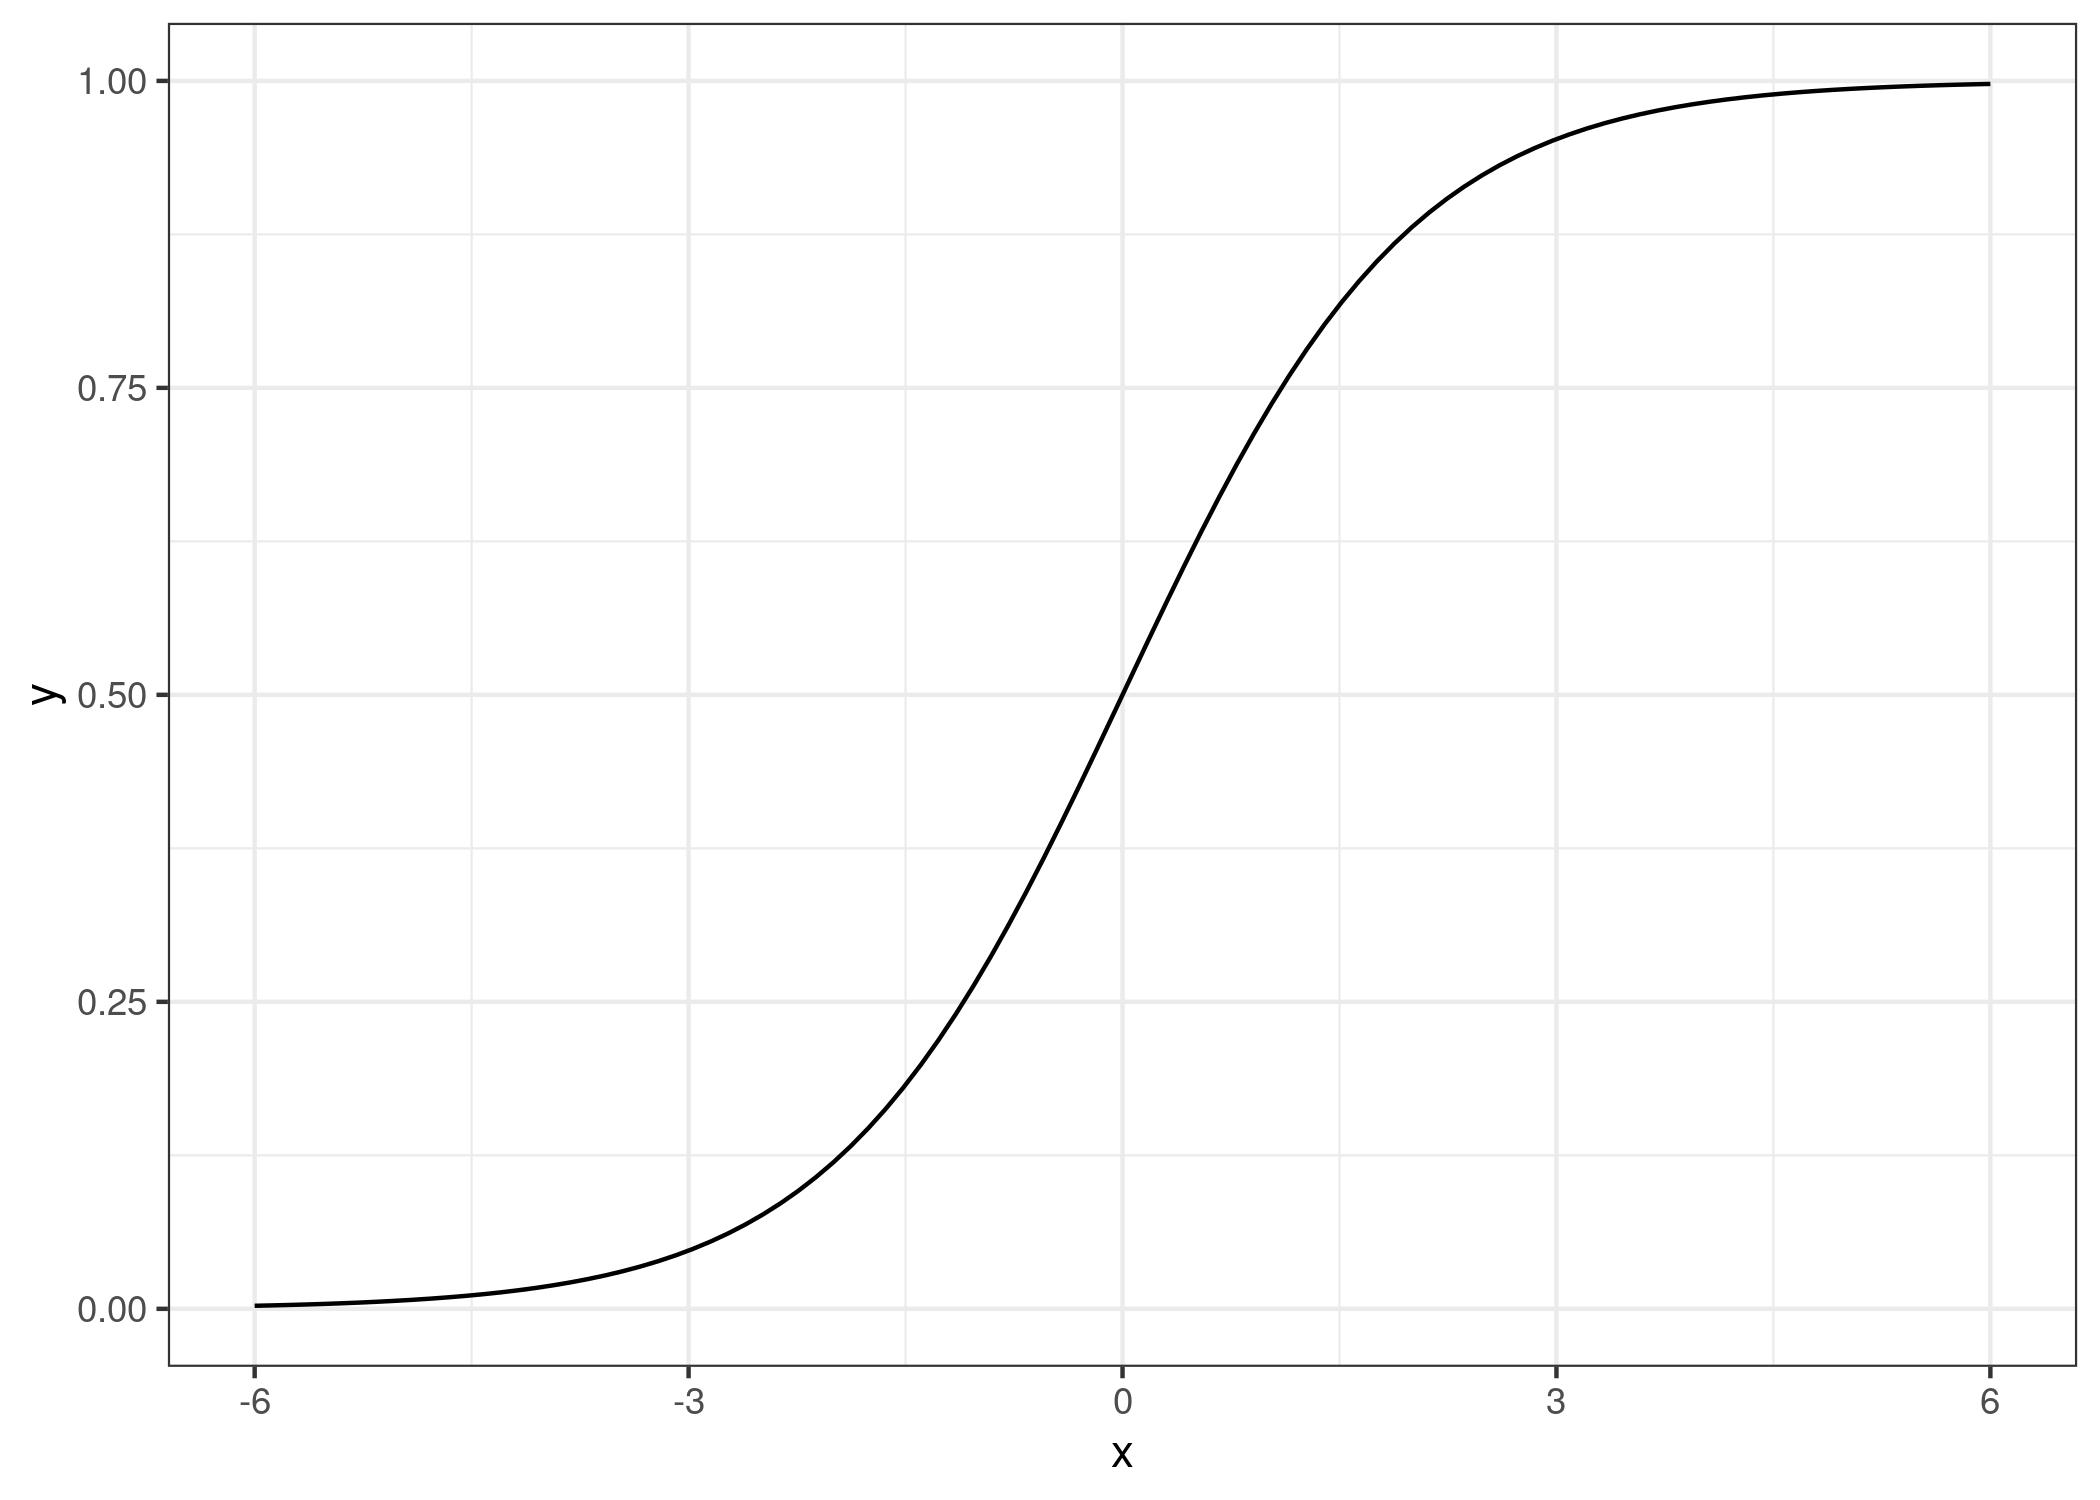
A solution for classification is logistic regression. Instead of fitting a straight line or hyperplane, the logistic regression model uses the logistic function to squeeze the output of a linear equation between 0 and 1. The logistic function is defined as:

And it looks like this:
The step from linear regression to logistic regression is kind of straightforward. In the linear regression model, we have modelled the relationship between outcome and features with a linear equation:

For classification, we prefer probabilities between 0 and 1, so we wrap the right side of the equation into the logistic function. This forces the output to assume only values between 0 and 1.

Let us revisit the tumor size example again. But instead of the linear regression model, we use the logistic regression model:
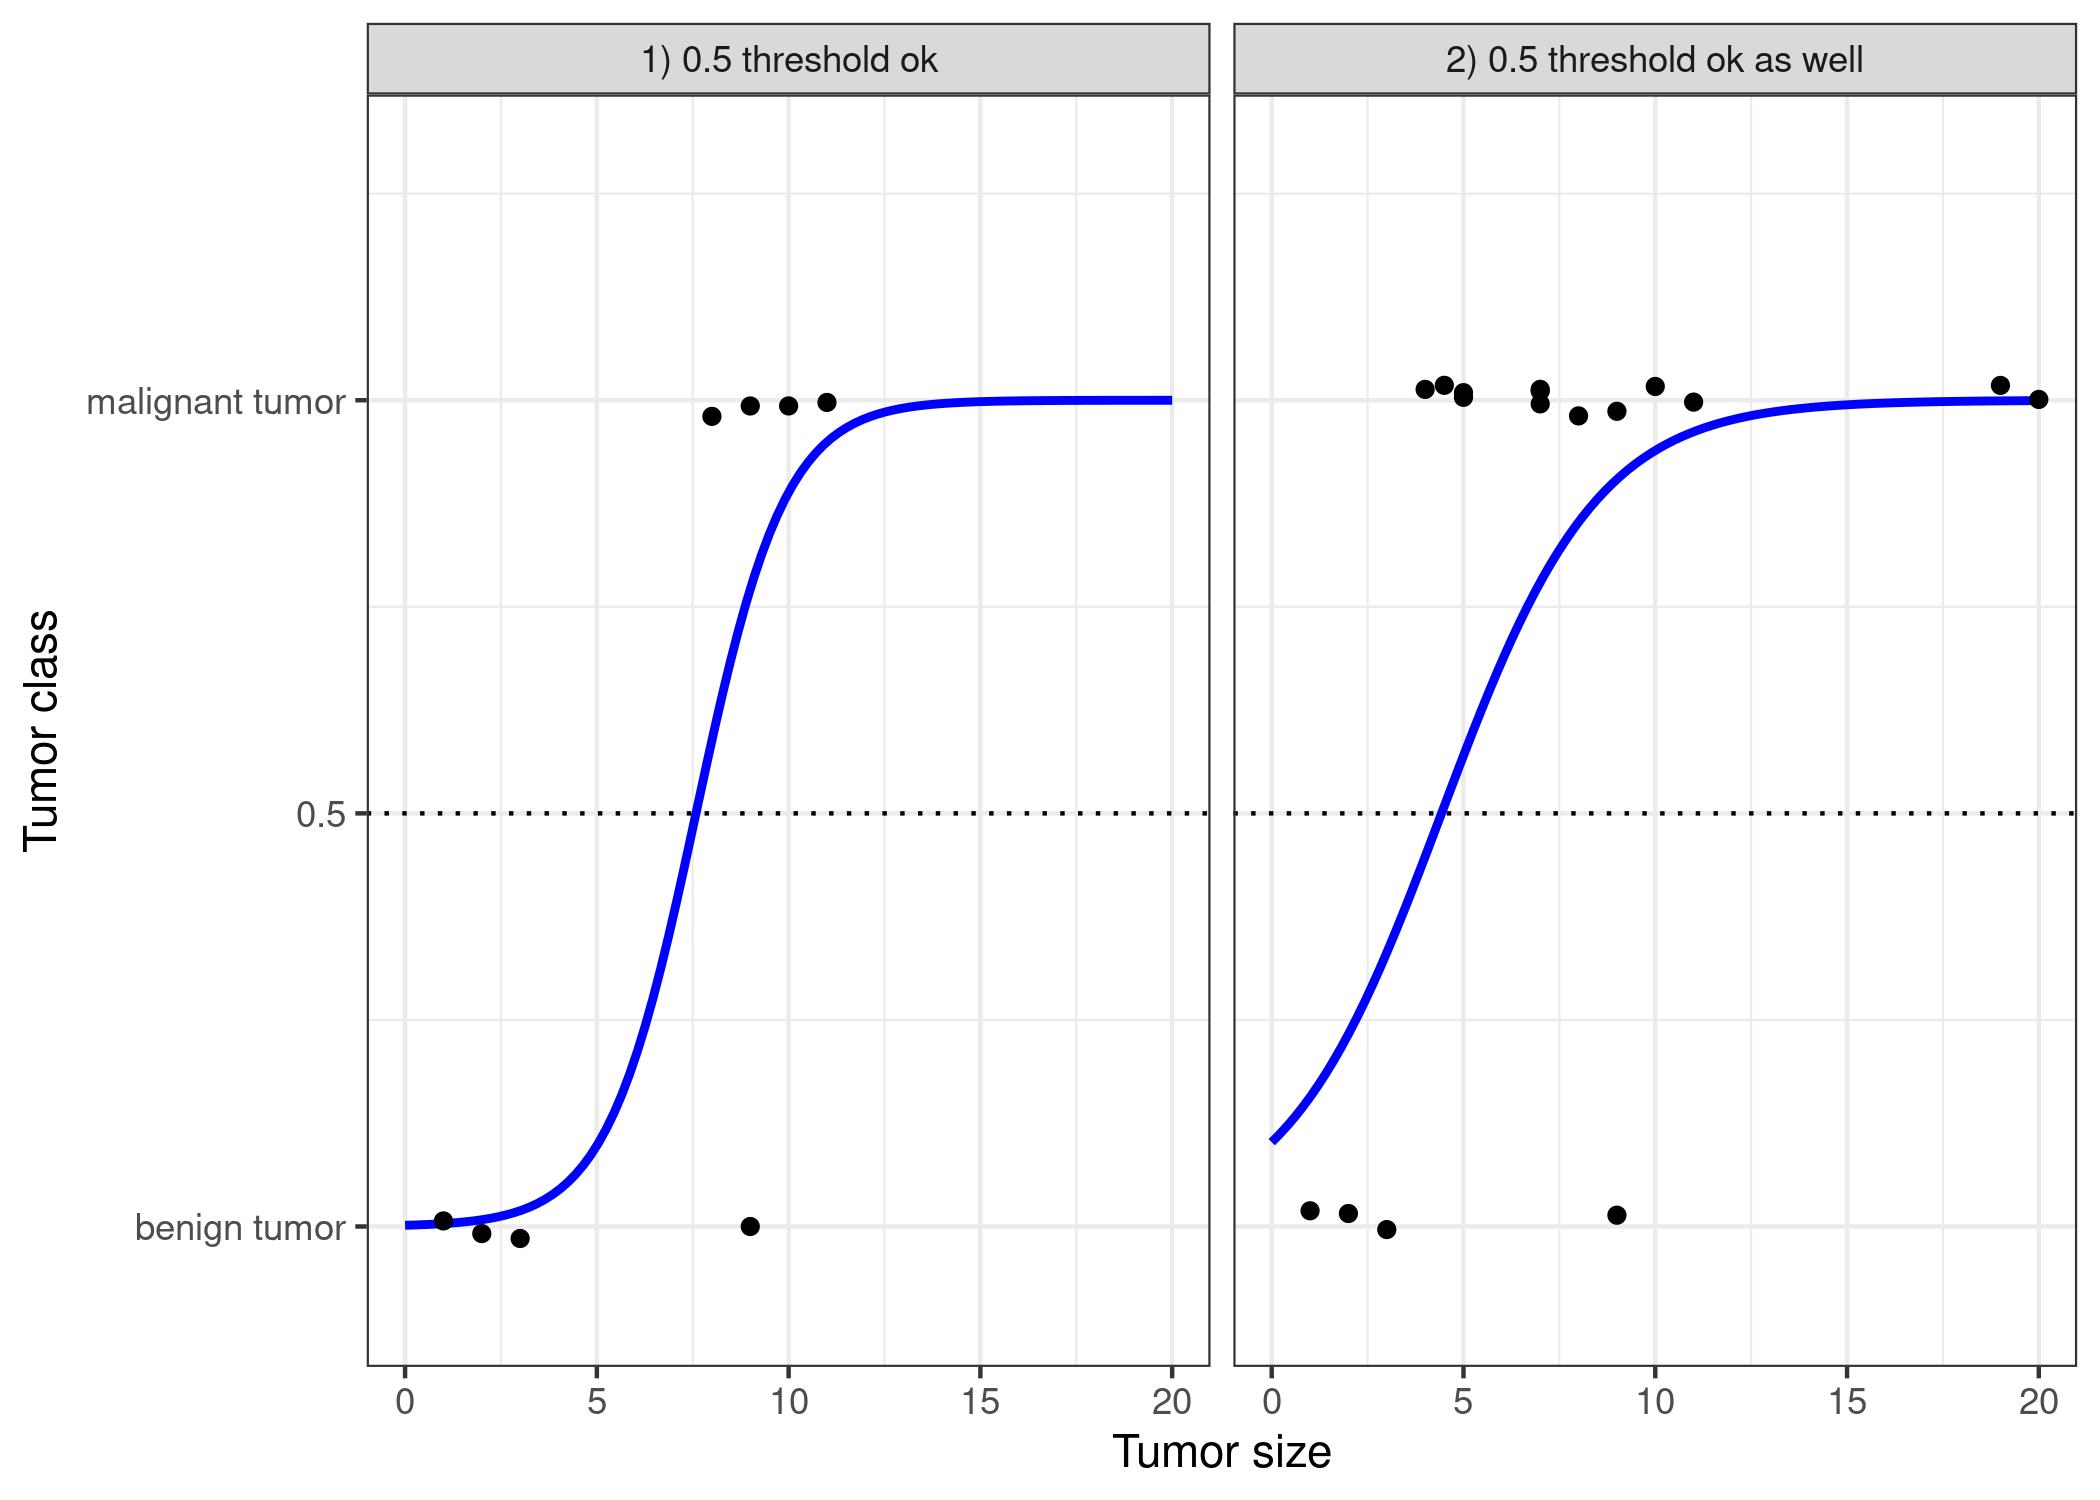
Classification works better with logistic regression and we can use 0.5 as a threshold in both cases. The inclusion of additional points does not really affect the estimated curve.
